Current Digital Issue
|
|
Click to read.
|

Past Digital Issues
|
|
Click to read.
|

FLCAJ 2020–2021 Salary and Information Survey
Published January 2021

Florida Community Association Journal is once again privileged to present the annual Salary and Information Survey. This year marks the 32nd year for the survey. The survey is mainly compiled using data from an online survey that is available every year from September 1 until December 1. As always, the survey depends on participation from our readers, and we want to thank all who responded whether by the web survey or the CondoJobs website. We trust this information will be helpful in evaluating salary and benefits in your community.
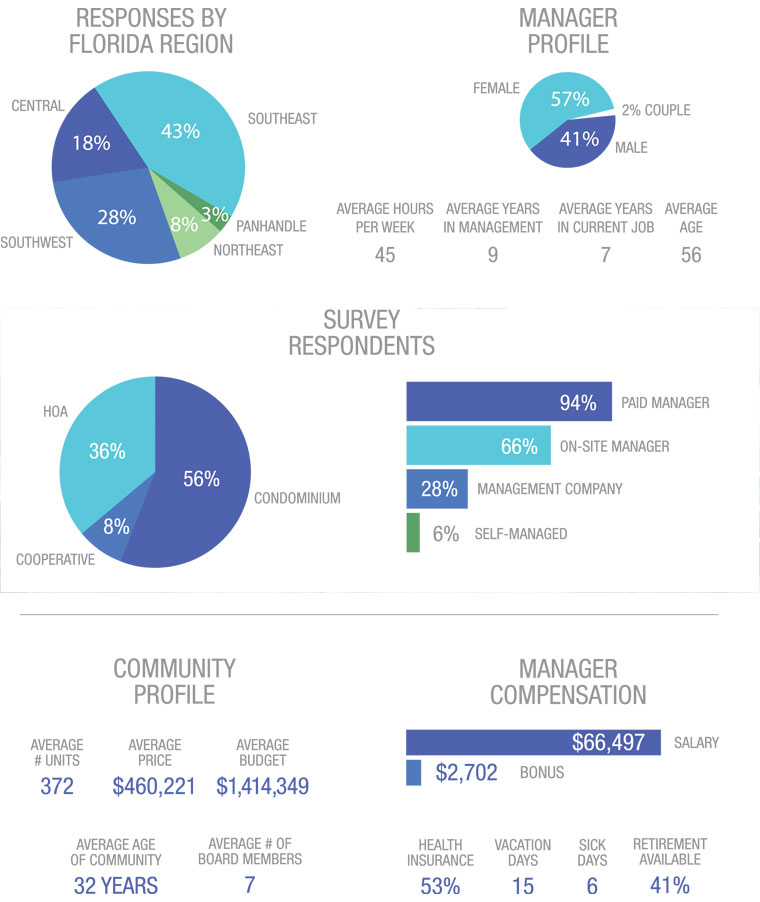
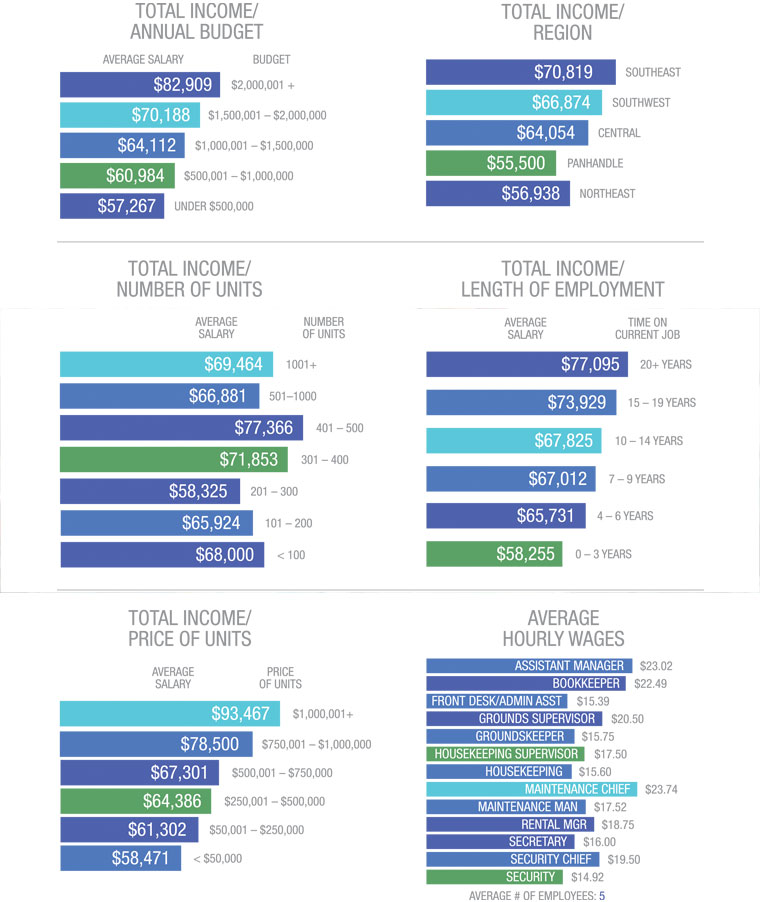
The survey is displayed in three pie charts, eight bar charts and a community profile that should make the information easier to see at a glance. The first pie chart breaks down responses by region, the second pie chart provides a general manager profile, and the third pie chart breaks down the type of association survey respondents live in and provides the first bar chart with typical manager profile information. The community profile was added to provide a snapshot of a typical community association. The manager compensation bar chart contains the average manager’s salary and benefits. The six total income bar charts compare salary ranges with several key indicators: region, number of units, price of units, total annual budget, and length of employment. The final bar chart lists average hourly wages for other typical community association employees.
General Summary
The largest percentage of responses to the salary survey came, as usual, from the Southeast region. Southwest Florida had the second most responses with Central Florida coming in third.
Condominiums represent more than half of the responses, with almost all using paid management. This year’s survey respondents used on-site management 66 percent of the time and management companies 28 percent of the time. Only six percent of the communities were self-managed.
The typical profile of a community surveyed in 2020 is one that is 32 years old and contains 372 units, with the average unit priced at $460,221. The average budget is $1,414,349. The average board of directors consists of seven volunteers. The amount of the last special assessment for the communities ranged from a total of $140,128–$5,000,000. The lower assessment amounts were for items like parking lot resurfacing, a sun deck addition, and pool resurfacing. The more expensive projects were garage restoration, concrete restoration, and a new roof. Twenty-one percent of the communities responded that they have fully funded reserves.
The manager profile shows the average age of a manager is 56. The breakdown of managers by gender is 57 percent female and 41 percent male with the other two percent being couples. The average number of years of management experience is nine, with the average manager having been at their current position for seven years and devoting at least 45 hours per week to the job.
The most important statistic for managers deals with compensation. Manager salaries averaged $66,497 statewide for 2020, which was a minor increase from last year’s $66,013. This was great to see in this challenging year. In addition, bonuses averaged more than $2,700. Health insurance is being provided to 53 percent of respondents and an IRA/401k is available to 41 percent. The average amount of vacation days came in at 15 with six sick/personal days being made available.
One negative change that was notable came in the average number of employees for each community. In 2019 the average community had nine employees, but this decreased to five employees in 2020. There could be a variety of explanations for this, but it is possible that a major factor has been the effects of COVID-19 that has led to various economic impacts. FLCAJ hopes to see this trend reversed in 2021.
If you wish to be included in next year’s survey, please visit fcapgroup.com/survey.
Go Mobile