Current Digital Issue
|
|
Click to read.
|

Past Digital Issues
|
|
Click to read.
|

FLCAJ 2023–2024 Salary and Information Survey
Published January 2024

Photo by iStockphoto.com/t:Imam Fathoni
Florida Community Association Journal is privileged for the 35th year to present the annual Salary and Information Survey. The Survey is compiled using data from an online survey that is available year-round. As always, the Survey depends on participation from our readers, managers, and board members alike, and we want to thank all who responded by the web survey. We trust this information will be helpful in evaluating salary and benefits in your community in 2024.
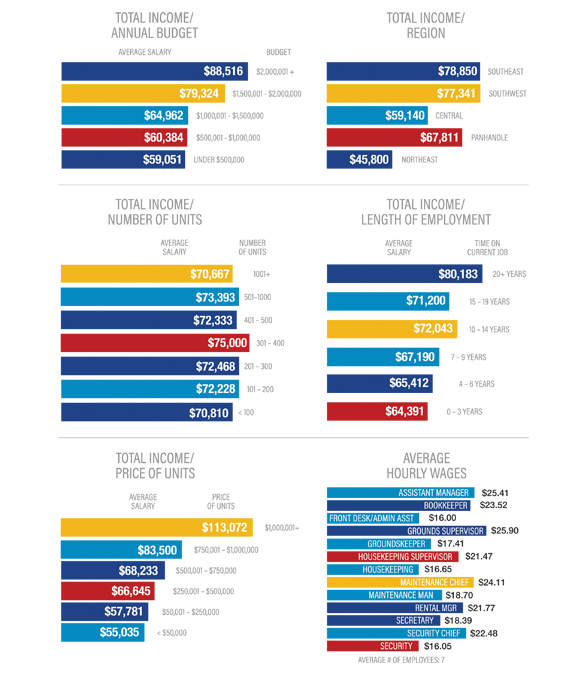
The Survey is displayed in three pie charts, eight bar charts, a community profile, and a manager’s compensation profile that should make the information easier to see at a glance. The first pie chart breaks down responses by region; the second pie chart provides a general manager profile; and the third pie chart breaks down the type of association survey respondents live in and supplements the first bar chart with typical manager profile information. The manager compensation bar chart contains the average manager’s salary and benefits. The five total income bar charts compare salary ranges with several key indicators: region, number of units, price of units, total annual budget, and length of employment. The final bar chart lists average hourly wages for other typical community association employees.
General Summary
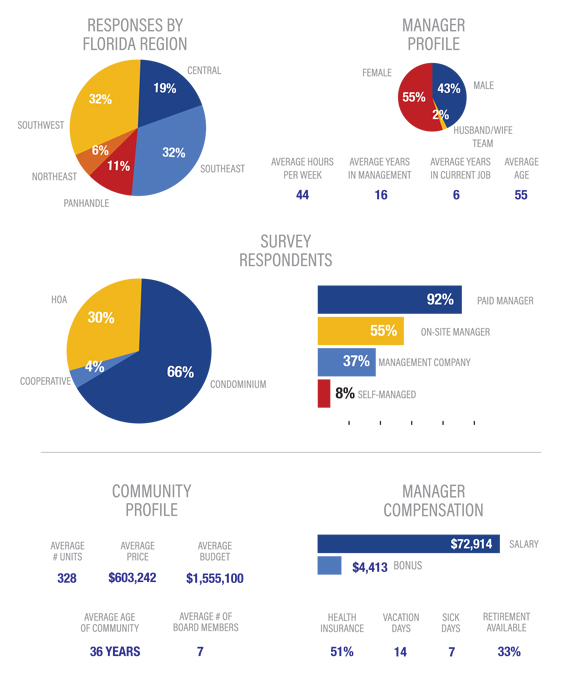
In 2023 the largest percentage of responses to the Salary Survey by region was tied with respondents from Southeast and Southwest Florida coming in at 32 percent. This was followed by Central Florida at 19 percent and the Panhandle at 11 percent.
Survey participants who live in condominiums represent two-thirds of the responses, with 92 percent using paid management. This year’s survey respondents used on-site management 55 percent of the time and management companies 37 percent of the time.
Community Profile
The survey participants responded to several questions about their community association. The typical community surveyed in 2023 is an average of 36 years old and consists of 328 units. The average price for a unit came in at $603,242 with the average community budget at $1,555,100. The average board of directors consists of seven volunteers. The amount of the last assessment for the communities ranged from $471–$1,200,000. The more expensive projects were structural restoration ($1,200,000), reroofing ($756,000) and insurance ($2,300 per owner). More than three-fourths of the communities surveyed reported that they were mostly or very pleased with how their communities were being managed.
Manager Profile and Compensation
The manager profile shows the average age of a manager is 55. The ratio of managers by biological sex is 55 percent female to 43 percent male with only two percent serving as a husband/wife team. The average number of years of total management experience is 16, with the average manager having been at their current position for six years and devoting at least 44 hours per week to the job.
The most important statistic for managers deals with compensation. Manager salaries averaged $72,914 statewide for 2023, with bonuses averaging $4,413. Health insurance is being provided to 51 percent of respondents, and an IRA/401k is available to 33 percent. The average number of vacation days came in at 14, with seven sick/personal days being made available.
Employees’ Average Hourly Wages
The average number of employees per community association came in at seven. Assistant managers, maintenance chiefs, and rental managers all saw increases in their hourly wages as compared with 2022.
FLCAJ hopes that you find this information useful and helpful as we move into 2024. We encourage you to take part in the 2024–2025 Salary and Information Survey by taking some time to visit www.fcapgroup.com/survey and filling out the survey as completely as you are able.
Go Mobile